Security Metrics and Measurement
Click any control badge to view its details. Download SVG
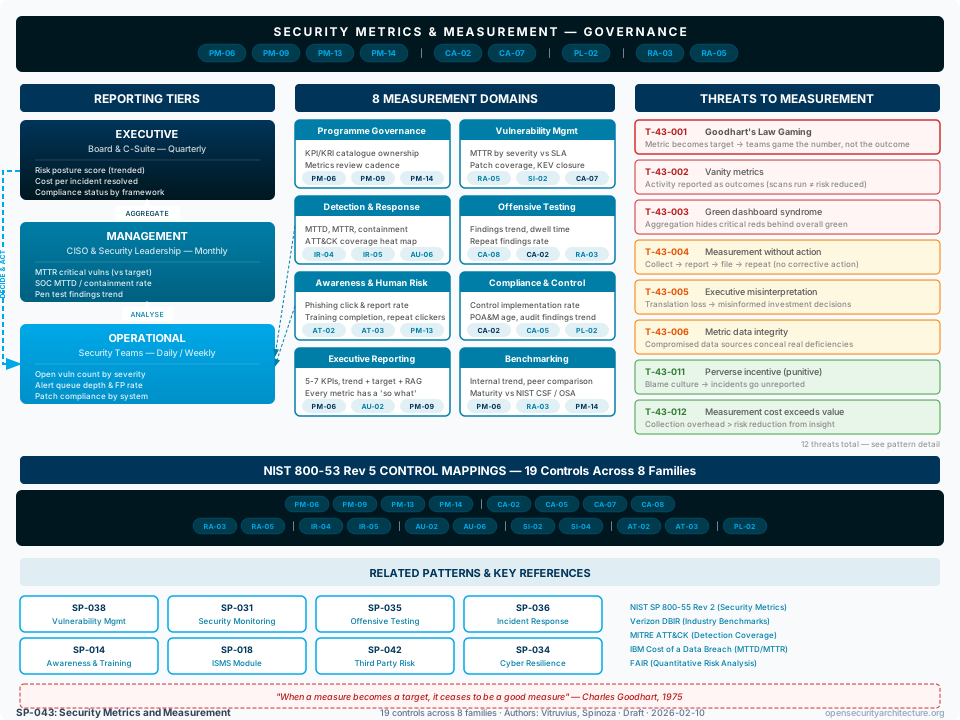
Key Control Areas
Programme Metrics and Governance
Vulnerability Management Metrics
Detection and Response Metrics
Offensive Testing Metrics
Awareness and Human Risk Metrics
Compliance and Control Effectiveness Metrics
Executive Reporting and Dashboard Design
Benchmarking and Industry Comparison
When to Use
Any organisation with a security programme that reports to executive management or the board. Organisations seeking to justify security investment through demonstrated outcomes. Security teams that want to move from qualitative risk statements to quantitative evidence. Organisations with multiple security tools generating data that is not aggregated into a coherent view. Any entity implementing OSA patterns that wants to measure their effectiveness over time.
When NOT to Use
Very small organisations where security is a part-time function and measurement overhead exceeds the value of the insight. Organisations in the very early stages of building a security programme where the priority is implementing basic controls, not measuring them.
Typical Challenges
Goodhart's Law — metrics become targets, causing gaming behaviour (closing tickets without investigation, patching easy items first, sending obviously fake phishing emails). Vanity metrics — measuring activity (scans run, trainings delivered) rather than outcomes (risk reduced, capability improved). Green dashboard syndrome — aggregating metrics to a level where everything looks green while individual risk areas are red. Measurement without action — collecting and reporting metrics that nobody uses for decision-making. Data quality — metrics derived from incomplete asset inventories, inconsistent severity classifications, or manual data entry. Cost of collection — the measurement programme consumes resources that could be spent on actual security improvement. Translation loss — operational metrics lose fidelity as they are aggregated and simplified for executive audiences. Baseline absence — setting targets without historical data leads to arbitrary thresholds. Lagging indicator dependency — most security metrics measure past performance, not predictive risk.
Threat Resistance
Addresses measurement gaming through outcome-focused metric design and multi-layered measurement (activity alone is never sufficient). Reduces executive misinterpretation through structured translation from operational to executive metrics with defined 'so what' actions. Prevents green dashboard syndrome through severity-weighted metrics and drill-down requirements. Ensures measurement drives action through governance cadence requiring documented response to metric deterioration. Provides industry context through benchmarking to prevent both complacency (we are fine) and false alarm (everything is broken).
Assumptions
The organisation has a security programme with multiple operational functions (vulnerability management, SOC, GRC, awareness). Data sources exist for metric collection (vulnerability scanner, SIEM, ticketing system, GRC platform). Security leadership has a reporting obligation to executive management or the board. The organisation wants to move beyond compliance-driven security toward risk-driven security with measurable outcomes.
Developing Areas
- OCSF (Open Cybersecurity Schema Framework) adoption for security data normalisation is gaining momentum as organisations struggle to aggregate metrics across heterogeneous tool stacks. Without a common schema, correlating vulnerability data from Qualys with incident data from Splunk and access data from Okta requires custom ETL pipelines per tool pair. OCSF promises vendor-neutral event normalisation, but adoption is in early stages -- fewer than 20 security vendors have published OCSF mappings, and the schema itself is still evolving with quarterly releases adding new event classes.
- The shift from activity-based metrics to outcome-based metrics is well-understood conceptually but poorly implemented in practice. Most security teams can measure what they did (patches applied, alerts triaged, trainings delivered) but struggle to measure what changed as a result (risk reduced, exposure decreased, capability improved). Outcome measurement requires causal attribution that is methodologically difficult -- did MTTR improve because of SOAR automation or because the threat landscape was quieter this quarter? Emerging approaches use synthetic control methods and A/B testing adapted from product analytics, but these techniques are foreign to most security teams.
- Security data lake analytics maturity is improving as cloud-native SIEM platforms (Chronicle, Sentinel, Panther) offer long-term retention and ad-hoc query capabilities that legacy SIEMs could not. The ability to run arbitrary analytical queries across years of security telemetry enables retrospective metric calculation, trend analysis, and threat hunting that periodic reporting cannot match. However, the cost of storing and querying petabytes of security data, combined with the analytics skills required to extract meaningful insights, limits this capability to large enterprises.
- Risk quantification using FAIR (Factor Analysis of Information Risk) is gaining board-level interest as executives demand financial language for cyber risk. FAIR enables statements like 'our annualised loss expectancy from ransomware is $4.2M' rather than 'ransomware risk is rated High'. However, FAIR implementations require input data (threat event frequency, vulnerability prevalence, loss magnitude distributions) that most organisations cannot reliably estimate. The result is often false precision -- a quantified number that implies more confidence than the underlying data supports.
- Cross-organisation benchmarking remains hampered by inconsistent metric definitions and reluctance to share data. When Organisation A reports MTTR of 15 days and Organisation B reports 25 days, the difference may reflect measurement methodology (when does the clock start?), severity classification (what counts as critical?), or scope (all assets or production only?) rather than actual performance difference. Industry initiatives (FS-ISAC benchmarking, CIS metrics) are working toward standardised definitions, but participation rates remain below the threshold needed for statistically meaningful peer comparison in most sectors.
Related Patterns
Patterns that operate within or alongside this one. Click any to view.
References
- NIST SP 800-55 Vol. 1 — Measurement Guide for Information Security: Identifying and Selecting Measures
NIST's guide to developing, selecting and prioritising information security measures, published in December 2024 in place of SP 800-55 Rev 1. Defines four types of measure: implementation, effectiveness, efficiency and impact. Volume 2 covers building a measurement programme.
- CIS Controls v8 — Measures and Metrics
CIS Controls include specific metrics for each safeguard, organized into three Implementation Groups (IGs). Provides concrete measurement guidance for each control.
- NIST Cybersecurity Framework 2.0 — Outcome-Based Measurement
CSF 2.0 introduces outcome-based tiers and profiles that support maturity measurement. The Govern function (new in 2.0) includes GV.OC for organizational context measurement.
- Verizon Data Breach Investigations Report (DBIR)
Annual report providing industry benchmark data on attack patterns, breach timelines, threat actor profiles, and incident frequency by industry vertical. Essential benchmarking source.
- MITRE ATT&CK Framework — Detection Coverage Assessment
ATT&CK provides the taxonomy for measuring detection coverage. ATT&CK Navigator enables visual heat maps of technique coverage for SOC metrics.
- SANS Security Awareness Report
Annual benchmarking data for security awareness programme metrics including phishing click rates, training completion, and programme maturity by industry.
- Ponemon Institute / IBM — Cost of a Data Breach Report
Annual report providing financial benchmarks for breach costs, MTTD and MTTR benchmarks, and cost reduction analysis by control implementation (e.g., security AI/automation, incident response testing).
- Goodhart's Law — When a Measure Becomes a Target
Charles Goodhart's 1975 observation that metrics used as targets lose their value as measures. Foundational concept for understanding why poorly designed security metrics create perverse incentives.
- FAIR — Factor Analysis of Information Risk
Quantitative risk analysis model providing a taxonomy for measuring and communicating information risk in financial terms. Enables risk-based metric translation for executive audiences.
- OWASP SAMM v2.0 — Software Assurance Maturity Model
Maturity model for software security programmes with built-in measurement criteria for each practice area. Useful for benchmarking development security metrics.